Riojan parliamentary election, 2007
Riojan parliamentary election, 2007
.svg.png)
|
|
|
|
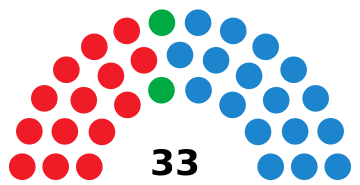
All 33 seats in the Parliament of La Rioja
17 seats needed for a majority |
| Registered |
237,745  1.8% 1.8% |
| Turnout |
174,257 (73.3%)
 1.8 pp 1.8 pp |
| |
First party |
Second party |
Third party |
| |
.jpg) |
 |
|
| Leader |
Pedro Sanz |
Francisco Martínez-Aldama |
Miguel González de Legarra |
| Party |
PP |
PSOE |
PR |
| Leader since |
2 October 1993 |
30 July 2000 |
16 December 1995 |
| Last election |
17 seats, 48.6% |
14 seats, 38.2% |
2 seats, 6.8% |
| Seats won |
17 |
14 |
2 |
| Seat change |
±0 |
±0 |
±0 |
| Popular vote |
84,382 |
69,858 |
10,369 |
| Percentage |
48.8% |
40.4% |
6.0% |
| Swing |
0.2 pp |
2.2 pp |
0.8 pp |
|
|
|
The 2007 Riojan parliamentary election was held on Sunday, 27 May 2007, to elect the 7th Parliament of La Rioja, the regional legislature of the Spanish autonomous community of La Rioja. At stake were all 33 seats in the Parliament, determining the President of La Rioja.
Electoral system
The number of seats in the Parliament of La Rioja was set to a fixed-number of 33. All Parliament members were elected in a single multi-member district, consisting of the Community's territory (the province of La Rioja), using the D'Hondt method and a closed-list proportional representation system.
Voting was on the basis of universal suffrage in a secret ballot. Only lists polling above 5% of valid votes in all of the community (which include blank ballots—for none of the above) were entitled to enter the seat distribution.[1]
Results
← Summary of the 27 May 2007 La Rioja Parliament election results →
| |
| Party |
Vote |
Seats |
| Votes |
% |
±pp |
Won |
+/− |
|
People's Party (PP) |
84,382 | 48.81 | 0.21 |
17 | ±0 |
|
Spanish Socialist Workers' Party (PSOE) |
69,858 | 40.41 | 2.23 |
14 | ±0 |
|
Riojan Party (PR) |
10,369 | 6.00 | 0.81 |
2 | ±0 |
| |
|
United Left-Citizen Initiative-The Greens (IZQ)[lower-alpha 1] |
5,292 | 3.06 | 1.30 |
0 | ±0 |
|
Blank ballots |
2,977 | 1.72 | 0.18 |
|
| |
| Total |
172,878 | 100.00 | |
33 | ±0 |
| |
| Valid votes |
172,878 | 99.21 | 0.04 |
|
| Invalid votes |
1,379 | 0.79 | 0.04 |
| Votes cast / turnout |
174,257 | 73.30 | 1.80 |
| Abstentions |
63,488 | 26.70 | 1.80 |
| Registered voters |
237,745 | |
| |
| Source: Argos Information Portal |
| Vote share |
|---|
|
|
|
|
|
| PP |
|
48.81% |
| PSOE |
|
40.41% |
| PR |
|
6.00% |
| IZQ |
|
3.06% |
| Blank ballots |
|
1.72% |
| Parliamentary seats |
|---|
|
|
|
|
|
| PP |
|
51.51% |
| PSOE |
|
42.42% |
| PR |
|
6.06% |
Notes
References