Murcian parliamentary election, 1987
| | |||||||||||||||||||||||||||||||||||||||||||||||||||||||||||||||||||||||||||||||||||||||||
| |||||||||||||||||||||||||||||||||||||||||||||||||||||||||||||||||||||||||||||||||||||||||
| |||||||||||||||||||||||||||||||||||||||||||||||||||||||||||||||||||||||||||||||||||||||||
| |||||||||||||||||||||||||||||||||||||||||||||||||||||||||||||||||||||||||||||||||||||||||
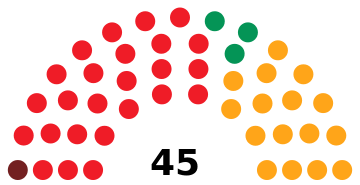
The 1987 Murcian parliamentary election was held on Wednesday, 10 June 1987, to elect the 2nd Regional Assembly of Murcia, the regional legislature of the Spanish autonomous community of the Region of Murcia. At stake were all seats in the Assembly, determining the President of the Region of Murcia. The number of members increased from 43 to 45 compared to the previous election.
The Spanish Socialist Workers' Party (PSOE) emerged as the largest party in the Assembly, but lost nearly 9 percentage points, falling from over 52% to just below 44%. However, Murcia's division into several electoral districts allowed the PSOE to minimize its loses, losing 1 seat from 1983 but still retaining a comfortable absolute majority in the Assembly. The People's Alliance (AP) stood alone in this election, having previously been a founding member of the late People's Coalition. Despite its former allies, the People's Democratic Party (PDP) and the Liberal Party (PL) not running for election in Murcia unlike what they did in other communities, AP still lost votes to the growing Democratic and Social Centre (CDS), a party founded by former Spanish Prime Minister Adolfo Suárez, which broke into the Assembly with 11.9% of the share and 3 seats.
Socialist Carlos Collado, who had accessed power in 1984 after the resignation of former regional premier Andrés Hernández Ros, was re-elected as President of Murcia for his first full-term in office.
Electoral system
The number of seats in the Regional Assembly of Murcia was set to a fixed-number of 45. All Assembly members were elected in 5 multi-member districts using the D'Hondt method and a closed-list proportional representation system. Unlike other regions, districts did not coincide with provincial limits, being determined by law as such:
- District One, comprising the municipalities of: Lorca, Aguilas, Puerto Lumbreras, Totana, Alhama de Murcia, Librilla, Aledo and Mazarrón.
- District Two, comprising the municipalities of: Cartagena, La Unión, Fuente Alamo de Murcia, Torre-Pacheco, San Javier and San Pedro del Pinatar.
- District Three, comprising the municipalities of: Murcia, Alcantarilla, Beniel, Molina de Segura, Alguazas, Las Torres de Cotillas, Lorquí, Ceutí, Cieza, Abarán, Blanca, Archena, Ricote, Ulea, Villanueva del Río Segura, Ojós, Fortuna, Abanilla and Santomera.
- District Four, comprising the municipalities of: Caravaca, Cehegín, Calasparra, Moratalla, Bullas, Pliego, Mula, Albudeite and Campos del Río.
- District Five, comprising the municipalities of: Jumilla and Yecla.
Voting was on the basis of universal suffrage in a secret ballot. Only lists polling above 5% of valid votes in all of the community (which include blank ballots—for none of the above) were entitled to enter the seat distribution. This meant that in the case a list polled above 5% in one or more of the districts but below 5% in the community totals, it would remain outside of the seat apportionment.[1]
Results
Overall
 | ||||||
| Party | Vote | Seats | ||||
|---|---|---|---|---|---|---|
| Votes | % | ±pp | Won | +/− | ||
| Spanish Socialist Workers' Party (PSOE) | 221,377 | 43.71 | |
25 | | |
| People's Alliance (AP)[lower-alpha 1] | 159,566 | 31.50 | |
16 | ±0 | |
| Democratic and Social Centre (CDS) | 60,419 | 11.93 | |
3 | | |
| United Left (IU)[lower-alpha 2] | 37,757 | 7.45 | |
1 | ±0 | |
| Cantonal Party (PCAN) | 17,212 | 3.40 | |
0 | ±0 | |
| Murcian Regionalist Party (PRM) | 1,976 | 0.39 | New | 0 | ±0 | |
| Workers' Party of Spain–Communist Unity (PTE-UC) | 1,918 | 0.38 | New | 0 | ±0 | |
| Humanist Platform (PH) | 1,429 | 0.28 | New | 0 | ±0 | |
| Blank ballots | 4,862 | 0.96 | |
|||
| Total | 506,516 | 100.00 | 45 | | ||
| Valid votes | 506,516 | 98.84 | |
|||
| Invalid votes | 5,928 | 1.16 | | |||
| Votes cast / turnout | 512,444 | 72.99 | | |||
| Abstentions | 189,624 | 27.01 | | |||
| Registered voters | 702,068 | |||||
| Source(s): Argos Information Portal | ||||||
Notes
- 1 2 Compared to the People's Coalition results in the 1983 election.
- 1 2 Compared to the Communist Party of Spain results in the 1983 election.
