United Kingdom general election, 1841
United Kingdom general election, 1841

|
|
|
|
|

|
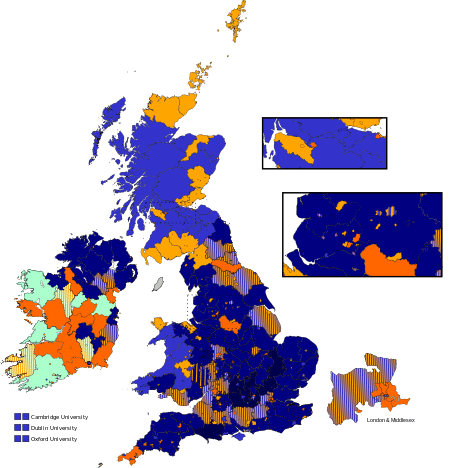
| Colours denote the winning party. |
|
|
In the 1841 United Kingdom general election, there was a big swing as Sir Robert Peel's Conservatives took control of the House of Commons. The Whigs lost votes to the Irish Repeal group. The Chartists picked up only a few votes despite their popular support, because voting was still restricted to a small percentage of the population. Only 3.17% of the total population voted. It is regarded as having been one of the most corrupt elections in British parliamentary history, the Westminster Review stating that the “annals of parliamentary warfare contained no page more stained with the foulness of corruption and falsehood than that which relates the history of the general election in the year 1841.”[1]
Results
| United Kingdom General Election 1841 |
|
Candidates |
Votes |
| Party |
Standing |
Elected |
Gained |
Unseated |
Net |
% of total |
% |
№ |
Net % |
| |
Conservative |
498 |
367 |
|
|
+ 53 |
|
50.9 |
306,314 |
+ 2.6 |
| |
Whig |
388 |
271 |
|
|
- 73 |
|
46.9 |
273,902 |
- 4.8 |
| |
Irish Repeal |
22 |
20 |
20 |
0 |
+ 20 |
|
2.1 |
12,537 |
N/A |
| |
Chartist |
8 |
0 |
0 |
0 |
0 |
|
0.1 |
692 |
N/A |
Total votes: 593,445[2]
Voting summary
| Popular vote |
|---|
|
|
|
|
|
| Conservative |
|
50.9% |
| Whig |
|
46.9% |
| Irish Repeal |
|
2.1% |
| Chartist |
|
0.1% |
Seats summary
| Parliamentary seats |
|---|
|
|
|
|
|
| Conservative |
|
55.78% |
| Whig |
|
41.19% |
| Irish Repeal |
|
3.04% |
Regional Results
Great Britain
| Party |
Candidates |
Unopposed |
Seats |
Seats change |
Votes |
% |
% Change |
|---|
|
Conservative |
439 |
185 |
326 |
 42 42 |
286,650 |
52.7 |
 4.5 4.5 |
|
Whig |
333 |
83 |
229 |
 42 42 |
256,774 |
47.2 |
 4.6 4.6 |
|
Chartist |
8 |
0 |
0 |
 |
692 |
0.1 |
New |
| Total |
780 |
268 |
555 |
 |
544,116 |
100 |
|
England
| Party |
Candidates |
Unopposed |
Seats |
Seats change |
Votes |
% |
% Change |
|---|
|
Conservative |
374 |
147 |
277 |
|
272,755 |
53.1 |
|
|
Whig |
277 |
62 |
187 |
|
236,813 |
46.8 |
|
|
Chartist |
4 |
0 |
0 |
 |
307 |
0.1 |
New |
| Total |
655 |
209 |
464 |
 |
509,875 |
100 |
|
Scotland
| Party |
Candidates |
Unopposed |
Seats |
Seats change |
Votes |
% |
% Change |
|---|
|
Whig |
40 |
13 |
31 |
|
16,356 |
60.8 |
|
|
Conservative |
35 |
16 |
22 |
|
9,793 |
38.3 |
|
|
Chartist |
3 |
0 |
0 |
 |
385 |
0.9 |
New |
| Total |
78 |
29 |
53 |
 |
26,534 |
100 |
|
Wales
| Party |
Candidates |
Unopposed |
Seats |
Seats change |
Votes |
% |
% Change |
|---|
|
Conservative |
24 |
16 |
21 |
|
4,102 |
53.2 |
|
|
Whig |
16 |
8 |
11 |
|
3,605 |
46.8 |
|
|
Chartist |
1 |
0 |
0 |
 |
0 |
0.0 |
New |
| Total |
41 |
24 |
32 |
 |
7,707 |
100 |
|
Ireland
| Party |
Candidates |
Unopposed |
Seats |
Seats change |
Votes |
% |
% Change |
|---|
|
Whig |
55 |
30 |
42 |
|
17,128 |
35.1 |
|
|
Conservative |
59 |
27 |
41 |
|
19,664 |
40.1 |
|
|
Repeal |
22 |
12 |
20 |
|
12,537 |
24.8 |
|
| Total |
136 |
69 |
103 |
|
49,329 |
100 |
|
Universities
| Party |
Candidates |
Unopposed |
Seats |
Seats change |
Votes |
% |
% Change |
|---|
|
Conservative |
6 |
6 |
6 |
 |
Uncontested |
Uncontested |
|
| Total |
6 |
6 |
6 |
 |
Uncontested |
Uncontested |
|
Whig MPs who lost their seats
References
- ↑ Baldwin, Craddock, Joy (1 January 1843). "Election Comprimises". THe Westminster Review. 39: 114. Retrieved 5 June 2016.
- ↑ British Electoral Facts 1832-2006, Compiled and edited by Colin Rallings and Michael Thrasher, (Parliamentary Research Services,2007)
- F. W. S. Craig, British Electoral Facts: 1832-1987
- British Electoral Facts 1832-1999, compiled and edited by Colin Rallings and Michael Thrasher (Ashgate Publishing Ltd 2000)
External links


