Queensland state election, 1938
Queensland state election, 1938

|
| 2 April 1938 (1938-04-02) |
|
|
|
|
|
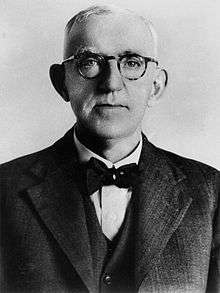
Elections were held in the Australian state of Queensland on 2 April 1938 to elect the 62 members of the state's Legislative Assembly. The Labor government of Premier William Forgan Smith was seeking a third term in office. During the previous term, the Country and United Australia parties had emerged from the united Country and Progressive National Party, which had represented conservative forces for over a decade.
The most notable feature of the election campaign was the Protestant Labor Party, established in 1937, which claimed that the Forgan Smith Ministry was disproportionately Catholic and made extravagant claims that three-quarters of all police and public servants in the State were Catholic.[1] Despite the campaign, Labor only lost one seat, Kelvin Grove, to the party.
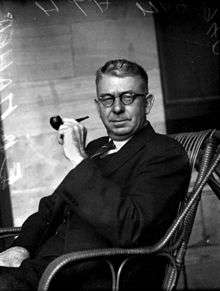
The unsuccessful Protestant Labor candidate for Ithaca, George Webb, lodged a petition against the return of Labor member Ned Hanlon.[2] He was initially successful in the Supreme Court when the case was heard by Justice E.A. Douglas, who voided the election result on 12 October on the basis of a finding that two men who had acted improperly were Hanlon's agents, but Hanlon appealed to the Full Bench of the Supreme Court and on 16 December 1938, his appeal was allowed.[3] A further appeal by Webb to the High Court was refused leave on 31 March 1939.[4]
Key dates
| Date |
Event |
| 5 March 1938 |
The Parliament was dissolved.[5] |
| 7 March 1938 |
Writs were issued by the Governor to proceed with an election.[6] |
| 14 March 1938 |
Close of nominations. |
| 2 April 1938 |
Polling day, between the hours of 8am and 6pm. |
| 12 April 1938 |
The Forgan Smith Ministry was re-sworn in.[7] |
| 16 April 1938 |
The poll was retaken in Gregory.[8] |
| 30 April 1938 |
The writ was returned and the results formally declared. |
| 9 August 1938 |
Parliament resumed for business.[9] |
Results
|
Queensland state election, 2 April 1938[10]
Legislative Assembly
<< 1935 — 1941 >> |
| Enrolled voters |
582,711[1] |
|
|
| Votes cast |
539,037 |
|
Turnout |
92.51% |
–0.19 |
| Informal votes |
7,058 |
|
Informal |
1.31% |
–0.43 |
| Summary of votes by party |
| Party |
Primary votes |
% |
Swing |
Seats |
Change |
| |
Labor |
250,943 |
47.17% |
–6.26 |
44 |
– 2 |
| |
Country |
120,469 |
22.65% |
· |
13 |
· |
| |
United Australia |
74,328 |
13.97% |
· |
4 |
· |
| |
Protestant Labor |
46,568 |
8.75% |
+8.75% |
1 |
+ 1 |
| |
Social Credit |
27,758 |
5.22% |
–1.80% |
0 |
± 0 |
| |
Communist |
8,510 |
1.60% |
+0.28 |
0 |
± 0 |
| |
Independent |
3,403 |
0.64% |
–2.73 |
0 |
± 0 |
| Total |
531,979 |
|
|
62 |
|
- 1 606,559 electors were enrolled to vote at the election, but 3 seats were uncontested—2 Labor seats (4 less than in 1935) representing 15,007 enrolled voters and one Country seat (one less than in 1935) representing 8,841 enrolled voters.
See also
References
External links

