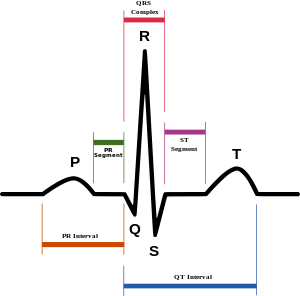
T wave

In electrocardiography, the T wave represents the repolarization (or recovery) of the ventricles. The interval from the beginning of the QRS complex to the apex of the T wave is referred to as the absolute refractory period. The last half of the T wave is referred to as the relative refractory period (or vulnerable period). The T wave contains more information than the QT interval. The T wave can be described by its symmetry, skewness, slope of ascending and descending limbs, amplitude and subintervals like the Tpeak–Tend interval.[1]
In most leads, the T wave is positive. This is due to the repolarization of the membrane. During ventricle contraction (QRS complex), the heart depolarizes. Repolarization of the ventricle happens in the opposite direction of depolarization and is negative current. This double negative (direction and charge) is why the T wave is positive; although the cell becomes more negatively charged, the net effect is in the positive direction, and the ECG reports this as a positive spike.[2] However, a negative T wave is normal in lead aVR. Lead V1 may have a positive, negative, or biphasic (positive followed by negative, or vice versa) T wave. In addition, it is not uncommon to have an isolated negative T wave in lead III, aVL, or aVF.
Clinical significance
- T-wave inversion (negative T waves) can be a sign of coronary ischemia, Wellens' syndrome, left ventricular hypertrophy, or CNS disorder.
- A periodic beat-to-beat variation in the amplitude or shape of the T wave may be termed T wave alternans.
- Tall and narrow ("peaked" or "tented") symmetrical T waves may indicate hyperkalemia.
- Flat T waves (less than 1 mV in the limb leads and less than 2 mV in the precordial leads)[3] may indicate coronary ischemia or hypokalemia[3]
- The earliest electrocardiographic finding of ST-elevation MI (STEMI) acute myocardial infarction is sometimes the hyperacute T wave, which can be distinguished from hyperkalemia by the broad base and slight asymmetry. This may also be seen in Prinzmetal angina.
- When a bundle branch block is present, the T wave should be deflected opposite the terminal deflection of the QRS complex. This is known as appropriate T wave discordance.
Frequency of inverted T-waves in precordial leads (lead V1 to V6) according to gender and age
Numbers from Lepeschkin E in [4]
| Age (ethnicity) | n | V1 | V2 | V3 | V4 | V5 | V6 | |
|---|---|---|---|---|---|---|---|---|
| Children | ||||||||
| 1 week - 1 y | 210 | 92% | 74% | 27% | 20% | 0.5% | 0% | |
| 1 y - 2 y | 154 | 96% | 85% | 39% | 10% | 0.7% | 0% | |
| 2 y - 5 y | 202 | 98% | 50% | 22% | 7% | 1% | 0% | |
| 5 y - 8 y | 94 | 91% | 25% | 14% | 5% | 1% | 1% | |
| 8 y - 16 y | 90 | 62% | 7% | 2% | 0% | 0% | 0% | |
| Males | ||||||||
| 12 y - 13 y | 209 | 47% | 7% | 0% | 0% | 0% | 0% | |
| 13 y - 14 y | 260 | 35% | 4.6% | 0.8% | 0% | 0% | 0% | |
| 16 y - 19 y (whites) | 50 | 32% | 0% | 0% | 0% | 0% | 0% | |
| 16 y - 19 y (blacks) | 310 | 46% | 7% | 2.9% | 1.3% | 0% | 0% | |
| 20 - 30 y (whites) | 285 | 41% | 0% | 0% | 0% | 0% | 0% | |
| 20 - 30 y (blacks) | 295 | 37% | 0% | 0% | 0% | 0% | 0% | |
| Females | ||||||||
| 12 y - 13 y | 174 | 69% | 11% | 1.2% | 0% | 0% | 0% | |
| 13 y - 14 y | 154 | 52% | 8.4% | 1.4% | 0% | 0% | 0% | |
| 16 y - 19 y (whites) | 50 | 66% | 0% | 0% | 0% | 0% | 0% | |
| 16 - 19 y (blacks) | 310 | 73% | 9% | 1.3% | 0.6% | 0% | 0% | |
| 20 - 30 y (whites) | 280 | 55% | 0% | 0% | 0% | 0% | 0% | |
| 20 - 30 y (blacks) | 330 | 55% | 2.4% | 1% | 0% | 0% | 0% | |
References
- ↑ Haarmark C, Graff C, Andersen MP, et al. (2010). "Reference values of electrocardiogram repolarization variables in a healthy population". Journal of Electrocardiology. 43 (1): 31–9. doi:10.1016/j.jelectrocard.2009.08.001. PMID 19740481.
- ↑ http://www.kumc.edu/AMA-MSS/Study/phys2.htm
- 1 2 Loyola University Chicago Stritch School of Medicine. > EKG Interpretive skills Retrieved on April 22, 2010
- ↑ Antaloczy, Z (1979). Modern Electrocardiology. Amsterdam: Excerpta Medica. p. 401.