Shooting star (candlestick pattern)

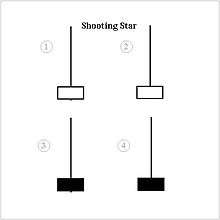
In technical analysis, a shooting star is interpreted as a type of reversal pattern presaging a falling price. The Shooting Star looks exactly the same as the Inverted hammer, but instead of being found in a downtrend it is found in an uptrend and thus has different implications. Like the Inverted hammer it is made up of a candle with a small lower body, little or no lower wick, and a long upper wick that is at least two times the size of the lower body.
The long upper wick of the candlestick pattern indicates that the buyers drove prices up at some point during the period in which the candle was formed but encountered selling pressure which drove prices back down for the period to close near to where they opened. As this occurred in an uptrend the selling pressure is seen as a potential reversal sign. After encountering this pattern traders often check for a lower open on the next period before considering the sell-signal valid.
As with the Inverted hammer most traders will see a longer wick as a sign of a greater potential reversal and like to see an increase in volume on the day the Shooting Star forms.
See also
- Inverted hammer — Shooting star pattern found in a downtrend
- Shooting Star Information at candlecharts.com
External links
- Shooting star pattern at onlinetradingconcepts.com
- Bearish Shooting star at candlesticker.com
- Shooting star definition at investopedia.com
| ||||||||||||||||||||||||||||||||||||||||||||||||||||||||