Color layout descriptor
A color layout descriptor (CLD) is designed to capture the spatial distribution of color in an image. The feature extraction process consists of two parts; grid based representative color selection and discrete cosine transform with quantization.
Color is the most basic quality of the visual contents, therefore it is possible to use colors to describe and represent an image. The MPEG-7 standard has tested the most efficient procedure to describe the color and has selected those that have provided more satisfactory results. This standard proposes different methods to obtain these descriptors, and one tool defined to describe the color is the CLD, that permits describing the color relation between sequences or group of images.
The CLD captures the spatial layout of the representative colors on a grid superimposed on a region or image. Representation is based on coefficients of the discrete cosine transform (DCT). This is a very compact descriptor being highly efficient in fast browsing and search applications. It can be applied to still images as well as to video segments.
Definition
The CLD is a very compact and resolution-invariant representation of color for high-speed image retrieval and it has been designed to efficiently represent the spatial distribution of colors. This feature can be used for a wide variety of similarity-based retrieval, content filtering and visualization. It is especially useful for spatial structure-based retrieval applications. This descriptor is obtained by applying the DCT transformation on a 2-D array of local representative colors in Y or Cb or Cr color space. The functionalities of the CLD are basically the matching:
- – Image-to-image matching
- – Video clip-to-video clip matching
Remark that the CLD is one of the most precise and fast color descriptor.

Extraction
The extraction process of this color descriptor consists of four stages:
- Image partitioning
- Representative color selection
- DCT transformation
- Zigzag scanning
The standard MPEG-7 recommends using the YCbCr color space for the CLD. If you need, you can convert the color space using these formulas.

Image partitioning
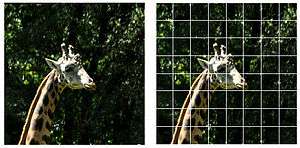
In the image partitioning stage, the input picture (on RGB color space) is divided into 64 blocks to guarantee the invariance to resolution or scale. The inputs and outputs of this step are summarized in the following table:
| Input stage 1 | Output stage 1 |
|---|---|
| Input picture [M x N] | Input picture divided into 64 blocks [M/8xN/8] |

Representative color selection
After the image partitioning stage, a single representative color is selected from each block. Any method to select the representative color can be applied, but the standard recommends the use of the average of the pixel colors in a block as the corresponding representative color, since it is simpler and the description accuracy is sufficient in general. The selection results in a tiny image icon of size 8x8. The next figure shows this process. Note that in the image of the figure, the resolution of the original image has been maintained only in order to facilitate its representation. The inputs and outputs of this stage are summarized in the next table:
| Input stage 2 | Output stage 2 |
|---|---|
| Input picture divided into 64 blocks [M/8xN/8] | Tiny image icon [8x8] |
Once the tiny image icon is obtained, the color space conversion between RGB and YCbCr is applied.
| Input stage 3 | Output stage 3 |
|---|---|
| Tiny image icon [8x8] in RGB color space | Tiny image icon [8x8] in YCbCr color space |
DCT transformation
In the fourth stage, the luminance (Y) and the blue and red chrominance (Cb and Cr) are transformed by 8x8 DCT, so three sets of 64 DCT coefficients are obtained. To calculate the DCT in a 2D array, the formulas below are used.
The inputs and outputs of this stage are summarized in the next table:
| Input stage 4 | Output stage 4 |
|---|---|
| Tiny image icon [8x8] in YCbCr color space | 3 [8x8] matrix of 64 coefficients (DCTY, DCTCb, DCTCr) |

Zigzag scanning
A zigzag scanning is performed with these three sets of 64 DCT coefficients, following the schema presented in the figure. The purpose of the zigzag scan is to group the low frequency coefficients of the 8x8 matrix. The inputs and outputs of this stage are summarized in the next table:
| Input stage 5 | Output stage 5 |
|---|---|
| 3 [8x8] matrix of 64 coefficients (DCTY, DCTCb, DCTCr) | 3 zigzag scanned matrix (DY, DCb, DCr) |
Finally, these three set of matrices correspond to the CLD of the input image.
Matching
The matching process helps to evaluate if two elements are equal comparing both elements and calculating the distance between them. In the case of color descriptors the matching process helps to evaluate if two images are similar. Its procedure is the following:
- – Given an image as an input, the application attempts to find an image with a similar descriptor in a data base of images.
If we consider two CLDs:
- {DY, DCb, DCr}
- { DY‟, DCb‟, DCr‟ },
The distance between the two descriptors can be computed as:
The subscript i represents the zigzag-scanning order of the coefficients. Furthermore, notice that is possible to weight the coefficients (w) in order to adjust the performance of the matching process. These weights let us give to some components of the descriptor more importance than others. Observing the formula, it can be extracted that:
- – 2 images are the same if the distance is 0
- – 2 images are similar if the distance is near to 0
Therefore, this matching process will let to identify images with similar color descriptors. Since the complexity of the similarity matching process shown above is low, high-speed image matching can be achieved.
Implementation
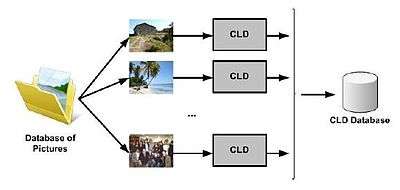
We aim to find images with similar colors, thus, we have to extract the CLD from these images and afterwards compare these descriptors with the matching technique. Consequently, it is possible to define two main parts in the implementation of this method:
- – Process a database of pictures to obtain its CLD
- – Find similarity matching between an input picture and the processed database
The following figure shows the process of analyzing a database:
-
 Implementation.
-
In this process, a database of pictures is analyzed in order to obtain the CLD representing each picture. This process consists of uploading the image into memory and computing the descriptor as explained in the previous section. The final result is a database of CLDs linked to the images that represent.
Once the database of images has been analyzed, the matching between an input image and the database of CLD is carried out. With this process, it will be obtained images with similar colors ordered according to increasing distances.
See also
- MPEG-7
- Visual descriptors
- JPEG – Contains an easier to understand example of DCT transformation
External links
- MASTER THESIS – Color Based Image Classification and Description (Sergi Laencina Verdaguer)
- Relating visual and semantic image descriptors (J. Stauder and J. Sirot)
- Fusing MPEG-7 visual descriptors for image classification
- MPEG-7 Overview (Color Layout)